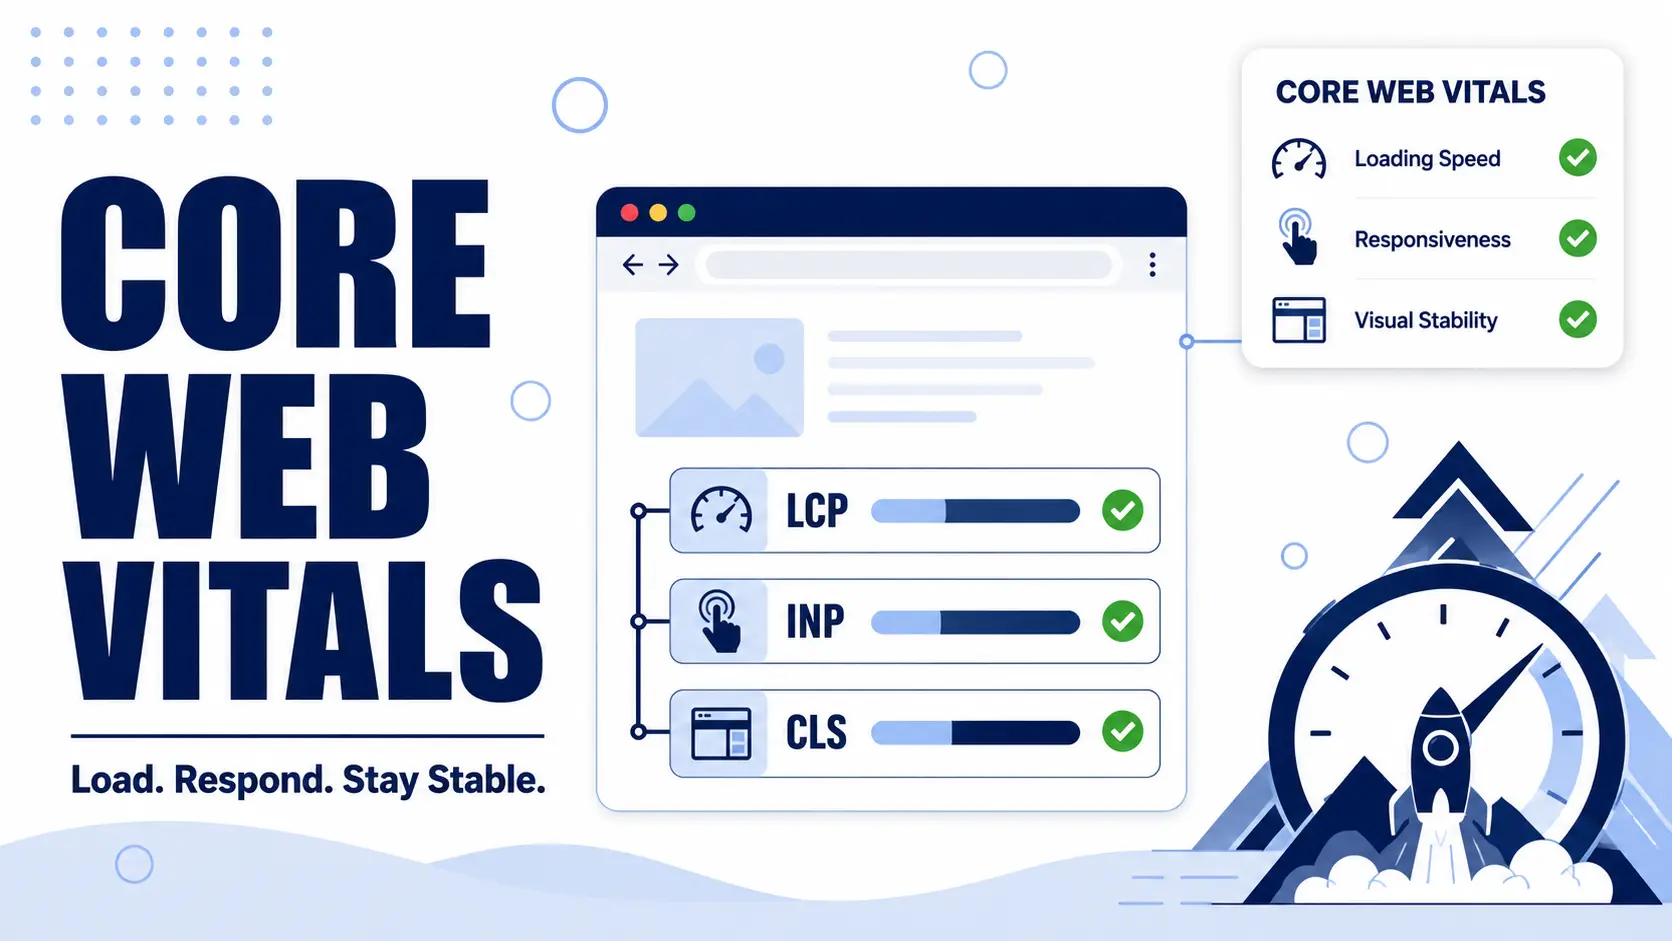
The Complete Guide of Core Web Vitals and How to Actually Improve Your Score
Core Web Vitals might be the reason your visitors are leaving before they even see what you built for them. You spend hours writing the perfect headline, polishing your design, and making sure every word earns its place on the page. Then someone clicks in, waits a beat too long for it to load, and taps back before your content ever gets a chance. That moment is exactly what Core Web Vitals measure, and it happens more often than most site owners realize.
I have seen this play out on real websites, where the content was genuinely good but the numbers behind the scenes were quietly working against it. A page that shifts around while loading, or takes its time showing the first meaningful thing on screen, feels off even if a visitor cannot name why. Google noticed the same pattern across the web, which is why it built a set of metrics to capture that feeling and turn it into something measurable.
What Are Core Web Vitals?
Core Web Vitals are a set of three metrics that Google uses to measure how a real person experiences your webpage while it loads and while they interact with it. They were introduced to move page quality away from guesswork and into something you can actually see and improve, with real numbers attached to real user behavior.
Each metric focuses on a different moment in that experience. One looks at how quickly the main content becomes visible. Another looks at how responsive your page feels when someone actually clicks, taps, or types. The third looks at how stable the layout stays while everything is loading in, so buttons and text don’t jump around right as someone tries to interact with them.
The Google Core Web Vitals include:
- Largest Contentful Paint (LCP) measures how long it takes for the biggest visible element on your page to fully load and appear on screen. This is usually a hero image, a large block of text, or a featured video, whatever takes up the most space in what a visitor sees first. A fast LCP tells someone your page is working the moment they land on it, instead of leaving them staring at a blank or half-loaded screen.
- Interaction to Next Paint (INP) measures how quickly your page responds after someone interacts with it, whether that’s clicking a button, opening a menu, or filling out a form. It replaced an older metric called First Input Delay in March 2024, because INP captures responsiveness across the entire visit rather than just the very first click. If your page feels sluggish or delayed every time someone tries to do something on it, INP is usually the metric telling that story.
- Cumulative Layout Shift (CLS) measures how much your page’s content moves around unexpectedly while it loads. You’ve probably experienced this yourself, going to tap a button only to have an ad or image load in above it and shift everything down at the last second. CLS puts a number on exactly how much that kind of shifting happens, so you can catch it before it frustrates your own visitors.
Why INP Replaced FID
Google spent years watching First Input Delay in action and realized it only captured one moment, the delay before a page’s very first response. It didn’t say anything about how the page behaved for the rest of the session.
INP was built to fix that gap, tracking responsiveness across every interaction someone has with your page, not just the opening one. If you’re still seeing FID mentioned anywhere in older tools or articles, know that Google officially confirmed the switch to INP on March 12, 2024, so INP has fully taken its place as the metric that matters.
Why Are Core Web Vitals Important?
Think about the last time you left a website before it even finished loading. You probably didn’t think twice about it. You just closed the tab and moved on to the next search result. That split-second decision happens millions of times a day, and it’s exactly why Core Web Vitals matter so much.
The User Experience Impact
Every extra second your page takes to load is a chance for someone to lose interest and leave. Studies on user behavior consistently show that even small delays push bounce rates up and pull engagement down. A page that loads fast and stays stable while doing it doesn’t just feel nicer, it actually keeps people around long enough to read what you wrote or buy what you’re selling.
Layout shifts create a similar kind of friction, just in a different way. When something moves right as a visitor is about to tap it, that tiny frustration adds up. It might not make someone leave immediately, but it chips away at how much they trust your site to behave the way they expect.
The Business Impact
Good Core Web Vitals scores tend to show up directly in business numbers. Faster, more stable pages convert better, whether that means more newsletter signups, more product purchases, or more people actually finishing a contact form instead of abandoning it halfway through. Slow pages don’t just lose visitors, they quietly lose revenue too, often without anyone realizing exactly where it’s leaking from.
This is part of why so many businesses treat Core Web Vitals as more than a technical checkbox. It’s less about chasing a perfect score for its own sake, and more about removing the small frictions that stand between someone landing on your page and actually doing what they came there to do.
Also Read: The Complete Guide to Technical SEO And Why Your Content Isn’t Ranking Without It
How Do Core Web Vitals Affect SEO?
Google has been upfront that Core Web Vitals are part of what it calls page experience, and page experience plays into how your content gets ranked. That doesn’t mean a perfect score guarantees a spot at the top, but it does mean ignoring these metrics puts you at a real disadvantage against competitors who haven’t.
Google has confirmed that Core Web Vitals are used by its ranking systems, particularly when two pages are otherwise similar in quality and relevance. In that kind of tie breaker situation, the page that loads faster and behaves more predictably tends to win out. It’s worth being realistic here though, since strong content and solid backlinks still carry far more weight than your LCP score ever will.
Core Web Vitals sit alongside dozens of other ranking factors, so they’re rarely going to make or break your rankings on their own. Think of them less as a lever you pull for instant results, and more as one piece of a much bigger picture that includes your content quality, search intent match, backlink profile, and overall site authority. A technically flawless page with thin or unhelpful content still won’t outrank a slower page that actually answers what someone searched for.
The bigger impact often comes from how Core Web Vitals shape user behavior, which then feeds back into your rankings indirectly. When your pages load fast and stay stable, people stick around longer, click through to more pages, and bounce less, all signals that tell Google your site is worth showing to more people. There’s also a crawl efficiency angle, since faster pages are easier for Googlebot to crawl and index, which matters more the bigger your site gets.
Core Web Vitals vs Page Experience
It’s easy to mix these two terms up, especially since they get mentioned together so often. Page experience is actually the bigger umbrella, and Core Web Vitals is just one part sitting inside it. Think of page experience as everything that shapes how someone feels while using your site, and Core Web Vitals as the specific speed and stability numbers that back up that feeling.
So when someone asks whether they should focus on Core Web Vitals or page experience, the honest answer is that you’re not really choosing between two separate things. Core Web Vitals is the part you can measure and improve with specific numbers, while page experience is the bigger picture those numbers feed into.
Getting your Core Web Vitals in good shape naturally pulls the rest of your page experience up with it, since a fast, stable page usually comes from the same kind of careful build as a secure, mobile-friendly one.
Core Web Vitals Score for Recommended Thresholds (Good vs Needs Improvement vs Poor)
Once you understand what each metric measures, the next question is naturally what counts as good enough. Google set specific thresholds for this, and knowing them gives you something concrete to aim for instead of just chasing a vague sense of faster.
LCP thresholds
Largest Contentful Paint is considered good at 2.5 seconds or under. Anything between 2.5 and 4 seconds needs improvement, and past 4 seconds counts as poor.

INP thresholds
Interaction to Next Paint follows a similar pattern. Good sits at 200 milliseconds or under, needs improvement stretches up to 500 milliseconds, and anything beyond that is poor.

CLS thresholds
Cumulative Layout Shift works on a different scale since it’s measuring movement rather than time. Good lands at 0.1 or under, needs improvement covers up to 0.25, and poor is anything higher.

These thresholds come straight from Google’s own field data benchmarks, so treat them as a real target rather than a rough guideline. If your Search Console report shows a page sitting in the yellow or red zone here, that’s usually the clearest signal of which metric needs attention first.
How to Check Core Web Vitals
Knowing the thresholds only helps once you can actually see where your own pages stand. Thankfully Google gives you more than one way to check, and each tool shows the data from a slightly different angle.
Google Search Console
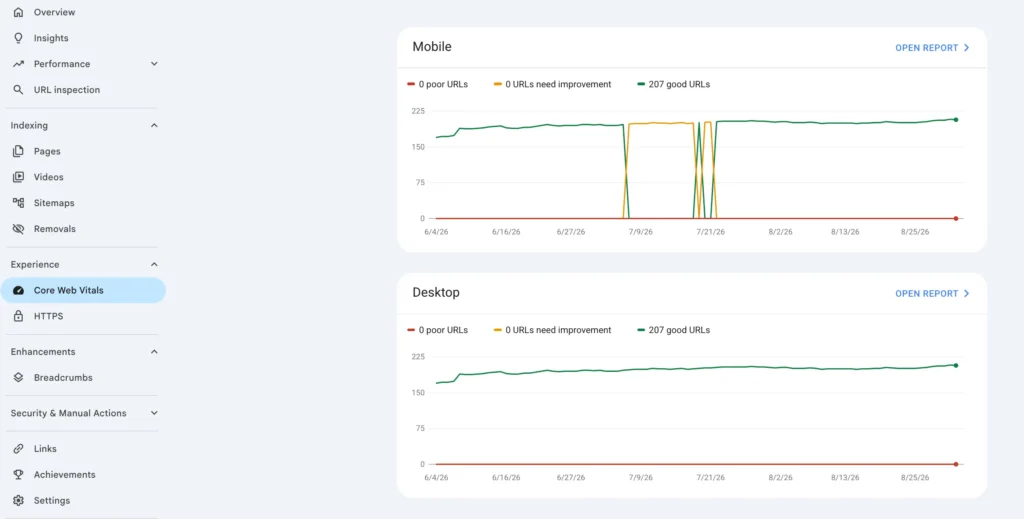
Search Console’s Core Web Vitals report is probably the most useful starting point since it shows real user data pulled straight from Chrome, grouped by URL and broken down into mobile and desktop. This is where you’ll spot patterns across your whole site rather than just one page, which makes it the best place to prioritize what to fix first.
PageSpeed Insights
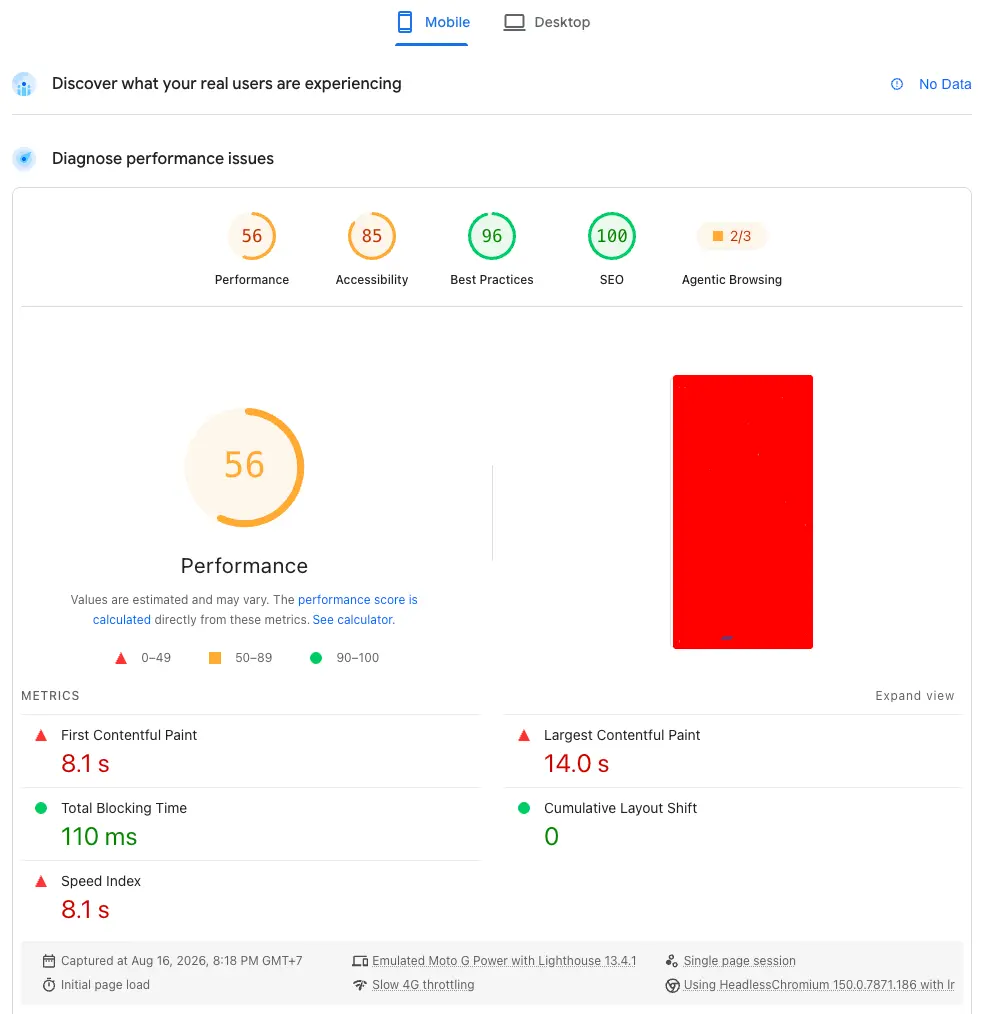
PageSpeed Insights provides both field data, which shows how real visitors actually experienced your page, and lab data, which comes from a simulated test run in a controlled environment. The field data reflects real-world performance, while the lab data is useful for testing changes before they go live because it updates instantly rather than waiting weeks for enough real traffic to accumulate. You can use a PageSpeed Insight test to identify performance issues and evaluate how your page performs across key metrics such as Core Web Vitals.
Chrome UX Report
Chrome UX Report, often shortened to CrUX, is the dataset behind most of these tools. It pulls anonymized performance data from real Chrome users who’ve opted in, and you can query it directly if you want raw numbers instead of a formatted report.
Chrome DevTools and Lighthouse
Chrome DevTools has a built in Lighthouse panel that runs a full performance audit right in your browser, flagging specific issues along with suggestions on how to fix them. This is the tool most developers reach for when they need to dig into exactly what’s slowing a page down, element by element.
Third party tools
Tools like GTmetrix and WebPageTest offer their own take on the same data, often with extra detail like waterfall charts or the ability to test from different global locations. They’re worth having in your toolkit, especially if you want to see how your site performs for visitors outside your usual audience.
Core Web Vitals for Mobile vs Desktop
Anyone who’s checked their scores has probably noticed mobile and desktop numbers don’t match, and there’s usually a good reason why they never will.
Phones typically run on slower processors, weaker connections, and smaller batteries compared to desktops, so the same page almost always performs worse on mobile even when nothing else has changed. Google factors this in too, since it uses mobile-first indexing across the board now, which means the mobile version of your site is what actually gets evaluated for ranking purposes, not the desktop one. That alone should tell you where to focus your energy if you’re only going to prioritize one.
That said, desktop still matters, especially if a meaningful chunk of your traffic comes from people browsing on laptops, whether that’s B2B audiences, older demographics, or industries where mobile browsing just isn’t the norm. The smartest approach is treating mobile as your baseline standard while still keeping an eye on desktop, rather than assuming a great desktop score means your site is actually performing well for the majority of visitors landing on it.
Common Core Web Vitals Problems and Their Solutions
This is usually where the real work happens, since knowing your scores are bad is one thing, but knowing exactly why takes a bit more digging. Here’s what tends to cause each metric to slip, along with what actually fixes it.
Common LCP problems
Slow LCP almost always comes down to something taking too long to load or render. The usual causes are
- Large, unoptimized images, especially hero images that haven’t been compressed or properly sized for the screen they’re displayed on
- Render blocking resources like unminified CSS and JavaScript, since the browser has to finish processing them before it can paint anything meaningful
- Slow server response times, particularly on shared hosting or when a site pulls data from a database without any caching in place
Fixing this usually starts with compressing and properly sizing your images, ideally converting them to a modern format like WebP. Minifying your CSS and JavaScript, along with deferring anything that isn’t needed immediately, takes care of most render blocking issues. On the server side, upgrading your hosting or adding a caching layer can shave meaningful time off your response times, especially if you’re still on shared hosting.
Common INP problems
Poor INP is almost always a JavaScript problem at its core. The usual causes are
- Heavy scripts running long tasks on the main thread, which blocks the browser from responding to anything a visitor does
- Too many third party scripts, like chat widgets, analytics tools, and ad networks, each adding its own bit of delay
- Large JavaScript bundles that load everything at once instead of only what the page actually needs
The fix usually involves breaking up long JavaScript tasks into smaller chunks so the browser gets more chances to respond to user input in between. Removing or lazy loading unnecessary third party scripts helps a lot too, since every script you can delay or cut entirely is one less thing competing for the main thread. Code splitting, where you only load the JavaScript a page actually needs, is another solid long term fix.
Common CLS problems
Layout shift usually happens because something on the page moves after a visitor has already started looking at or interacting with it. The usual causes are
- Images and videos without defined dimensions, since the browser doesn’t know how much space to reserve until they’ve actually loaded
- Web fonts that swap in late, shifting text around as the layout adjusts to the new font’s sizing
- Ads, embeds, and dynamically injected content, especially when they load in above content someone is already reading
The solution is mostly about giving the browser enough information upfront to reserve space correctly. Always set explicit width and height attributes on images and videos, and use font-display strategies that minimize the visual jump when a custom font loads in. For ads and embeds, reserving a fixed size container ahead of time stops them from pushing everything else around the moment they load.
Also Read: The Complete Guide of JavaScript SEO and How to Get Google to See Your Content
How to Improve Core Web Vitals on WordPress
WordPress powers a huge chunk of the web, which also means it’s responsible for a huge chunk of the slow, layout shifting pages Google keeps flagging. The good news is most of the usual fixes are well within reach even if you’re not a developer.
- Choosing a lightweight theme
Your theme is the foundation everything else sits on, so a bloated one makes every other optimization work harder than it needs to. Themes packed with built in sliders, animations, and page builders you’ll never use tend to ship a lot of unnecessary code that slows down every single page on your site. Switching to a lightweight, well coded theme is often the single biggest improvement you can make before touching anything else. - Image optimization
Images are usually the heaviest files on any WordPress page, so this is where a lot of your LCP gains will come from. Converting images to WebP, compressing them properly, and setting up lazy loading so images below the fold don’t load until someone actually scrolls to them all make a real difference. Plugins like Smush or ShortPixel handle most of this automatically, so you don’t have to manually optimize every image you upload. - Caching and CDN setup
A caching plugin stores a ready made version of your page so WordPress doesn’t have to rebuild it from scratch every single time someone visits, which cuts your server response time significantly. Pairing that with a CDN spreads your content across servers closer to wherever your visitors actually are, so someone browsing from the other side of the world isn’t waiting on a server that’s physically far away. - Reducing plugin bloat
Every plugin you install adds its own code, and a lot of that code runs whether you’re actively using the feature or not. Going through your plugin list and removing anything you don’t genuinely need, especially ones known for being heavy, can noticeably improve both your loading speed and your INP. - Optimizing web fonts and third party scripts
Custom fonts and third party scripts are two of the sneakier culprits behind poor Core Web Vitals scores on WordPress. Self hosting your fonts instead of pulling them from an external source cuts out an extra network request, and setting the right font display strategy prevents that jarring text shift when the font finally loads. Third party scripts, like chat widgets or tracking pixels, are worth auditing regularly since it’s easy to accumulate more of them than your site actually needs.

Get Your Core Web Vitals in Shape with Tsabit Insight
Core Web Vitals isn’t something you fix once and move on from, it’s an ongoing part of keeping your site healthy as your content grows, your traffic shifts, and Google keeps refining what it measures. If you’ve made it this far through this guide, you already know there’s a lot of moving pieces to manage well, from image compression to server response times to that one third party script that’s quietly wrecking your INP.
The good news is, you don’t have to manage all of it alone. At Tsabit Insight, I provide freelance SEO services built around exactly this kind of process, diagnosing what’s actually dragging your scores down, prioritizing the fixes that move the needle, and turning technical performance into something that supports your rankings instead of working against them. Every project starts with understanding your site’s real bottlenecks, the same way this guide walks through LCP, INP, and CLS one at a time, before any tool or audit gets involved.
Whether your Core Web Vitals report is sitting in the red or you’re just trying to squeeze out that last bit of improvement, the approach stays grounded in what genuinely moves your numbers, not just what looks good on paper. If you’re looking for a reliable freelance SEO specialist to help get your site’s performance where it needs to be, contact me to discuss your project and discover how Tsabit Insight can help your business grow through a faster, more stable site.
FAQ